01 / HindSight / The past
Your booth told a story.
Now you can read it.
Find what worked, what didn’t, and what deserves a place in your next show budget.
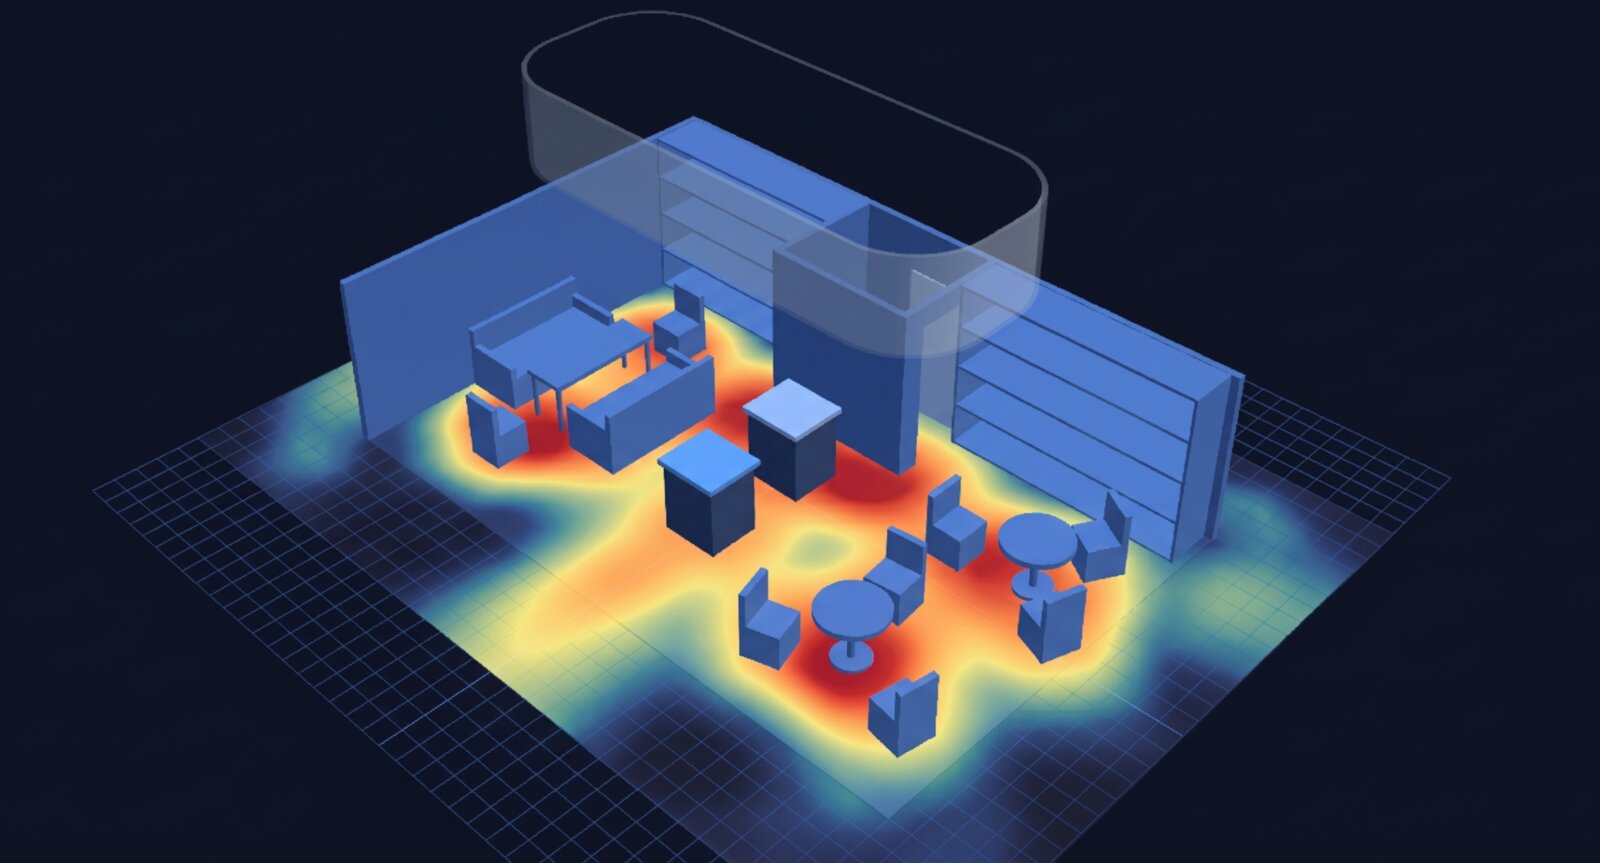
Follow the attention
Every square foot
has something to say.
Heatmaps turn movement and dwell time into a picture of engagement. See which displays held visitors, which spaces they crossed, and where your footprint could work harder.
- Compare attention across configured zones
- Separate passing through from stopping to engage
- Build a baseline for the next show
Make room for better tests
Product A or B?
Let the floor tell you.
Compare visits and time spent at two displays. Swap positions or change one element, then look for differences under comparable conditions.
A heatmap shows observed attention, not purchase intent. Placement, timing, and audience can all affect a comparison.
A held attention longer. Test what changes when the products swap positions.
Connect the investment
From “it felt busy”
to a budget conversation.
See the cost of creating an engaged visit. Add your attributed sales and gross margin to estimate event ROI—with the inputs visible, so the story can stand up to questions.
Explore the report format →Your next show starts here